
How to read MyRWA
MyRWA aggregates every on-chain venue for tokenized stocks, ETFs, indices and commodities - two tables (Stocks and Commodities) showing where each asset trades, its live price on each venue, market cap, P/E, price change, how deep the liquidity is, what the perp funding costs, and, above all, what a holder actually owns. This page explains every column, badge, filter and pop-up, with live examples. Hover any tag in the app for the short version; come here for the full one.
What this is
Every row is one real-world asset (for example AAPL, or gold). Expand it and you see every tokenized listing of that asset we track - across on-chain DEXes, centralized exchanges (CEX), perp venues, and issuer mint/redeem desks. The catalog is split into a Stocks table and a Commodities table; each is sorted by market cap by default, so the biggest assets sit on top.
The point of difference from a price screener: we surface the live price on each venue, score holder rights and issuer/venue trust for every listing, flag where an RFQ market maker fills with no pool slippage, and let you swap right in the pop-up on Solana and EVM chains - so you can tell a real claim on the share or metal apart from a synthetic price tracker before you trade.
It is data and aggregation, not investment advice. Some Trade buttons are referral links; that never changes the data, ranking or scores (full disclosure in Trade & referrals and Data).
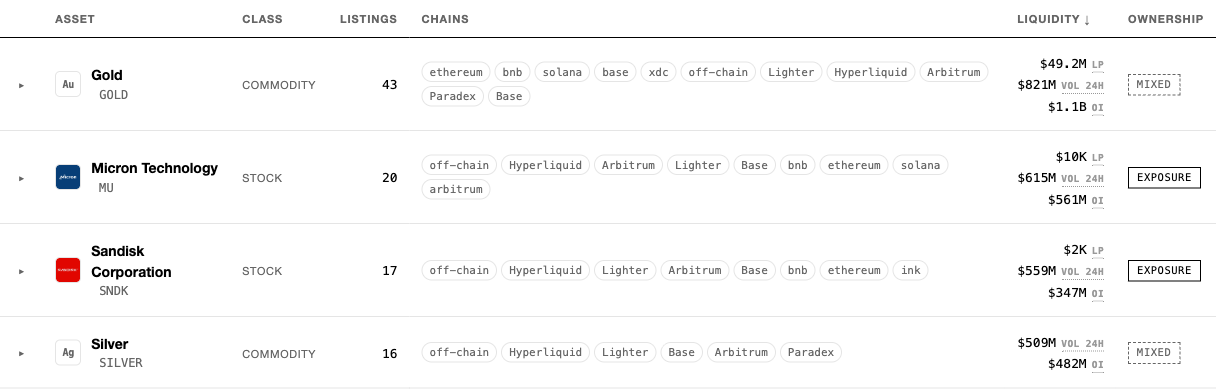
The main table - one asset per row, a live price under each ticker, sorted by total liquidity.
The two tables: Stocks & Commodities
The catalog is split into two tables - Stocks (equities, ETFs and indices) and Commodities (metals, energy and the like) - switched by the toggle next to the search box. Each table has its own columns, and a shared link keeps the active table (?tab=commodity).
Each collapsed row is one asset. Click the row or the arrow to expand it into its listings.
- Asset - the underlying real-world asset, with a live price under the ticker (see Prices). ETF and index rows carry a small ETF / INDEX tag next to the ticker; the Type filter narrows to one kind.
- Sector (Stocks only) - the sector of the underlying business (Technology, Financials, Healthcare, ...). Funds are typed by what they hold: Equity / Bond / Commodity / Crypto / Real estate fund, with broad trackers as Index fund. Volatility gathers VIX trackers and other complex instruments that are hard to classify into a standard sector (hover it for the note). Click to sort.
- Price change - the underlying's move over 1d / 7d / 1m. A multi-sort column: click the header and pick the period from its dropdown.
- MC - market cap. Stocks: shares outstanding x live price (ADR-correct for foreign names). Commodities: estimated total world supply x live price.
- P/E (Stocks only) - trailing price/earnings ratio; blank when the company has negative or no trailing earnings.
- Listings - how many distinct places the asset trades: DEX, CEX, perp, issuer.
- Liquidity - a multi-sort column: LP / Vol 24h / OI summed across the asset's listings; the dropdown picks which one to sort by. See Liquidity.
- Country (Stocks only) - where the company is headquartered; for index products and single-country funds, the country of the underlying exposure.
Sorting. The default order is market cap, descending. Click any header to sort by it; click again to flip. Assets missing a value always sort to the tail (with market cap as the tie-break), so a blank never floats above real data. Venue chips re-rank automatically: DEX switches the sort to LP, Perp / PerpDEX to Vol 24h (a sort you pick by hand afterwards is kept). The chain of each token and the per-listing "Holder gets" badge live inside the expanded row - see Expanded row and Holder rights.
The price line under a ticker: a green dot = live, an "at close" tag = market shut, "$-" = no market quote.
Inside an expanded row
Expanding an asset reveals one line per listing, with these per-venue columns:
- Token - the exact ticker/symbol of that wrapper on that venue.
- Issuer - who stands behind the listing (the token issuer, or the exchange for a CEX/perp). Hover the name for its trust rationale.
- Venue / Type - where you trade and whether it is Spot (you hold the token) or Perp (a cash-settled price derivative).
- Chain / Contract - the network and the on-chain token address. Use
↗to open a block explorer and⋕to copy the address. Always verify you are trading the real contract. - Price - the live price on that specific venue. See Prices.
- Liquidity, Funding, Holder gets, Trust, KYC, Mint/Redeem - covered in the sections below. A
◆RFQbadge in the Liquidity cell marks an RFQ market-maker fill (see Execution). - Trade - opens the pair, an embedded swap, or the issuer's KYC-and-mint walkthrough, depending on the venue (see Trade).
Every listing-table header is clickable to sort (price, liquidity, funding, trust, and the rest); by default listings inherit the main table's liquidity ranking. Assets with many listings paginate inside the row - the arrows and the per-page selector sit under the listing table.
A row of quick chips above the listing headers (Spot Perp DEX PerpDEX CEX Mint/redeem LP-RFQ LP:$50k+) narrows only this asset's listings - handy inside a 30-listing giant. Chips whose category has no listings in the asset are not shown at all, and each asset keeps its own selection.
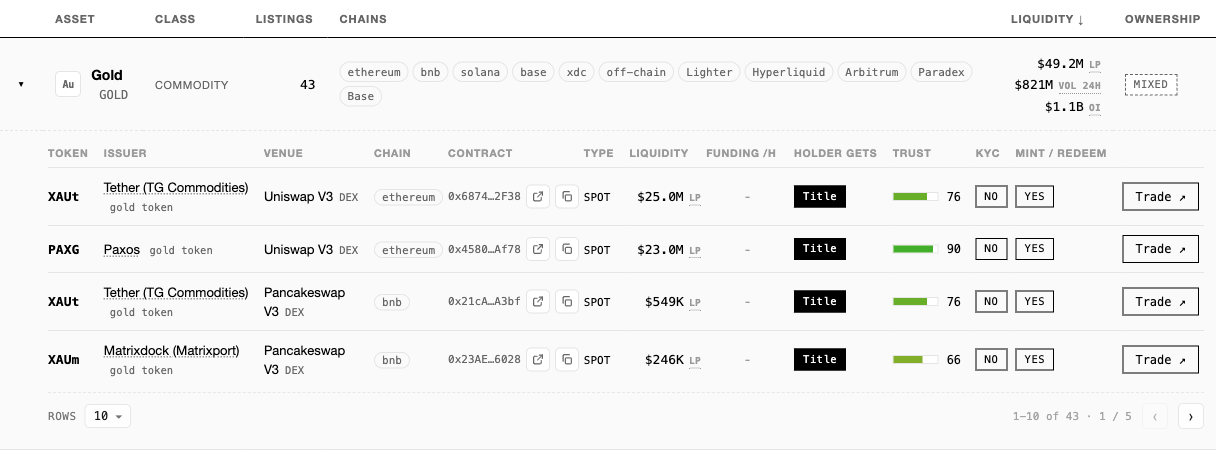
An expanded asset - every listing with its per-venue price and detail.
Prices
Two prices appear on MyRWA: the asset's underlying price under its ticker, and the actual price on each individual venue inside the expanded row. Both refresh about every minute (edge-cached, so the upstream is hit roughly once per minute for all visitors).
Underlying price under the ticker
The reference price of the real asset, from Yahoo Finance. Foreign shares (Korea, Japan, Hong Kong, mainland China) are converted to USD using live FX; index levels are point values and are shown as-is. Three visual states:
- A green dot = live (during that market's trading hours - US equities on NY hours, Asian names on their session, commodities treated as roughly 24h).
- at close = the market is shut; the last closing price is shown.
- $- = no market quote at all - the asset is private or trades only as a synthetic perp/future.
Per-listing Price in the expanded row
The actual price of that specific wrapper on that venue, resolved in this priority order:
- 1. Measured price (live) - the real on-chain pool price of the token (via DexScreener, taking the deepest-liquidity pair; a GeckoTerminal fallback covers chains DexScreener does not index, such as XDC), or a perp's live mark from the venue snapshot. A green dot marks it. Venues the live snapshot cannot reach show the pipeline-measured mark from the last data rebuild instead (no dot).
- 2. Underlying reference (ref) - where a wrapper has no measured price, we fall back to the underlying's market price, but only for single stocks, ETFs and index-tracking spot tokens. Index perps (they track the raw index level, roughly 10x the ETF a wrapper follows) and commodities (a gram-of-gold token is not an ounce) never get a reference price - a wrong number is worse than none. The ref tag sits under the price and takes the session color: green while the underlying market is open, red when it is closed (the price is then the last close).
- 3. Same-token price (ref) - the same wrapper often trades on several venues; a thin or unindexed venue borrows the live price of its twin elsewhere.
- 4. A dash
-when none of the above apply.
Search & filters
The search box matches asset name, ticker or on-chain token symbol - try AAPL, gold, PAXG, or a brand like xstocks. Filters combine, so you can stack as many as you like. They come in three views:
- Quick filters (the default) - a compact bar of one-tap chips under the search box, plus a More filters button. It covers the choices most people want: Spot Perp DEX PerpDEX CEX Mint/redeem Pre-IPO LP-RFQ LP:$50k+. Custody, KYC, Company and the venue-name lists live under More filters.
- More filters - opens the full advanced panel with every filter, grouped (the per-filter sections below). Once you open it, MyRWA remembers that: the quick bar stays hidden across refreshes until you reset.
- Custom mode - after you press Hide filters, the panel collapses to a small bar that shows how many filters are active, with Edit and Reset. A normal page refresh keeps your custom setup; only Reset (or clearing site data) brings the quick bar back.
Quick chips and advanced groups always stay in sync - they read the same underlying state. A shared link that carries a granular filter (Instrument, Rights, Issuer, Network, Perp DEX or CEX) opens straight into the advanced panel so nothing is hidden; a link using only quick-chip filters stays in quick mode. The brand logo, the footer link, or Reset clears everything and returns you to the top in quick mode.
Pre-IPO appears in the quick bar only when the active table contains private companies; segment-specific picks (Issuer, Network, Perp DEX, CEX, Company, Rights) reset when you switch tables.
Stocks / Commodities the table toggle
Not a filter chip but the segment toggle next to the search box: Stocks (equities, ETFs, indices) or Commodities (metals, energy and the like). Each table has its own columns and its own advanced-filter lists - see The two tables.
Type Stocks / ETF / Index · Stocks table only
Narrows the Stocks table to companies, ETFs (exchange-traded funds and trusts - most of them track an index) or indices (the raw index level, traded mostly as perps). By default the table shows all three together; ETF and index rows carry a small ETF / INDEX tag next to the ticker so the mix stays readable.
Instrument Spot / Perps / Pre-IPO
Spot = you hold and trade the token itself. Perps / Futures = any cash-settled derivative listing, on a perp-DEX or a perp-CEX. Pre-IPO (Stocks only) = genuinely private companies with no public market price (SpaceX, OpenAI, Anthropic and similar) - a curated flag, not a guess from a missing quote.
Holder gets Equity / Debt note / Title / Synthetic
Filter listings by the exact rights value: Equity and Debt note on Stocks, Title on Commodities, Synthetic on both. This is the core question MyRWA answers - full definitions in Holder rights.
Company Dividends · US / Non-US · Stocks only
Asset-level facets for equities. Dividends keeps assets with listings where the holder receives or accrues the underlying's dividends - equity spot tokens only; issuers that pass the dividend through are Ondo, Backed, Dinari and SwarmX (the chip appears only when such listings exist). US / Non-US filter by where the company is domiciled.
Sector Stocks only
Narrows to the sectors present in the table, most-populated first: company sectors (US names from Finnhub's industry profile, foreign and private names curated) plus the fund types (Equity / Index / Bond / Commodity / Crypto / Real estate fund). The Volatility chip collects VIX trackers (VXX, UVXY, SVOL) and other complex instruments that are hard to classify into a standard sector.
Execution Mint / redeem · LP-RFQ · LP-AMM
Three ways to execute, stackable:
- Mint / redeem - primary-market listings where you create or cash in the token at fair value (NAV) directly with the issuer, bypassing any pool. This is the issuer desk - the Trade pop-up walks you through KYC and the mint page (see Trade).
- Buy onchain (LP-RFQ) - a DEX pool listing that also has an RFQ market maker behind it: small orders trade the pool, larger ones are filled by the maker at a fixed spread with no pool slippage, via an RFQ route (on Solana, Jupiter's JupiterZ; on Robinhood Chain, Rialto - Robinhood's own maker venue, reached through Uniswap-ecosystem/LI.FI routing; on Ethereum/BNB/Base, CoW Swap's solver auction; on TON, STON.fi / Omniston inside Telegram Wallet). Marked ◆RFQ~X% in the Liquidity cell, where X is that fixed spread; hover for the exact figure. Importantly, a small visible pool does not cap your size here: the maker fills orders far beyond pool depth (probed live: a $250k Robinhood-Chain TSLA order filled at the same flat ~2% as a $100 one), so the thin-liquidity warning is replaced by an explainer in the trade pop-up. Above the maker's ceiling an order falls back to ordinary pool trading.
- Buy onchain (LP-AMM) - ordinary DEX pool listings with no RFQ maker: you trade against AMM liquidity and take pool slippage.
KYC
YES keeps venues that require identity verification; NO keeps permissionless on-chain venues. Every issuer mint desk is KYC-gated - the Trade pop-up for those listings links the exact verification and mint pages.
LP floor $50k+ / $100k+ / $250k+ / $500k+ / $1M+
An on-chain depth filter, per pool: only DEX listings whose own pool holds at least the bar stay, plus LP-RFQ listings regardless of pool size - a market maker fills those, so pool depth doesn't cap the trade. CEX and perp listings (measured by volume / OI, not LP) are hidden while a floor is active, and the asset stays only if at least one listing survives. Multiple picks OR together, so the lowest selected floor wins. The quick bar carries the $50k+ chip.
Issuer
Restrict to a specific token issuer. The list is the issuers actually present in the data: Ondo, Backed (xStocks), Dinari, SwarmX, Robinhood, VNX, Tether, Matrixdock, Paxos, ComTech, Kinesis, uranium.io. The Backed - xStocks entry also matches a free-text xstocks search. Synthetic-perp exchanges (Binance, MEXC, Gate, and the like) are deliberately not issuers - they live under the CEX and Perp DEX filters.
Custody On-chain / Off-chain
On-chain = bought with crypto and self-custodied - DEX, perp-DEX and issuer-direct mint (the token lives on a chain you control). Off-chain = a balance held inside a CEX (spot or perp). The quick bar carries the CEX chip (= off-chain custody); On-chain lives here under More filters. Off-chain is a custody concept, not a blockchain - it is filtered here, not under Network.
Network
Filter by the blockchain a token lives on - Solana, Base, Arbitrum, Ethereum, XDC and so on, ordered by how common they are. Multi-select, in the advanced panel. (CEX-held balances are handled by Custody, not here.)
Venue type CEX / DEX / Perp DEX / Issuer-direct
Filter listings by the kind of venue they trade on: CEX (centralized exchange, spot or futures), DEX (on-chain spot pools), Perp DEX (on-chain perpetuals) or Issuer-direct (Mint/redeem) (buying and redeeming straight at the issuer's desk). Multi-select. The quick-bar DEX and PerpDEX chips write the same filter, so the two bars stay in sync.
Perp DEX
Two things share this name. The quick-bar PerpDEX chip selects all perp-DEX venues at once. The advanced Perp DEX group lets you pick specific venues by name - Hyperliquid, Lighter, Ostium, gTrade, Avantis, Paradex and others. They are independent: the quick chip does not pre-select names in the advanced group.
CEX
The advanced CEX group picks specific centralized exchanges by brand (a brand's spot and its futures collapse under one name - Binance spot + Binance Futures = "Binance"). Note the naming overlap: the quick-bar CEX chip means "off-chain custody" (anything held on a CEX), while this advanced group means "a particular exchange brand".
Liquidity: LP, Volume, OI
Liquidity answers "how much can I trade, and how active is this market?". Spot listings show pool depth; perps show volume and open interest, stacked. Hover any tag in the app for the one-liner.
- LP - pool depth. The dollar value locked across every on-chain DEX pool holding this token on this chain (sum of all pool reserves, via GeckoTerminal), not just the deepest one. Bigger LP = larger trades with less slippage. This is real capital parked in the pools right now, not trading volume.
- vol 24h - the dollar amount traded on this venue over the last 24 hours. High volume = an active, easy-to-enter/exit market. It measures activity, not parked capital.
- OI (open interest) - the total dollar value of all perp positions currently open on this venue. Rising OI = growing participation.
- - (a dash) = an issuer-direct primary-market listing (mint/redeem at NAV), which has no secondary pool to measure.
The main table's Liquidity column is a multi-sort: its header dropdown picks LP, Vol 24h or OI, each summed across the asset's listings. A ⚠ flag next to LP means the pool is thin or its on-chain price is off the reference share/metal price - liquidity is shown, but treat it with caution. A ◆RFQ badge in this cell marks an RFQ market-maker fill.
Funding(APR)
For perps, funding is shown annualised (APR) so venues on different schedules (hourly, 4h, 8h) are directly comparable and the long-term carry cost is obvious at a glance. Positive = longs pay shorts; negative = shorts pay longs.
Hover a value for the pop-up: the rate per charge (e.g. per 4h on a 4-hour schedule), the per-day rate and its annualised APR (the same number as in the cell), how often it is actually charged, and a 3-day sparkline of the recent trend.
Live vs snapshot
- Hyperliquid is live: funding refreshes every minute, and its sparkline is served on demand.
- CEX perps show the latest pipeline snapshot. Every one ships with a dense 3-day chart from day one - the pipeline backfills each exchange's own funding-history endpoint, then keeps appending each run.
- Some perp-DEXes charge a continuous borrow/margin fee instead of periodic funding (shown as a fee tag with long/short rates), and a few publish no live rate at all - the pop-up says which and why.
Trust score
Expand an asset to see a 1-100 score per listing (100 = maximally trustworthy). It is not an opinion - hover the bar to see the underlying facts with sources.
- Token issuers - a transparent weighted rubric: regulation and legal structure, reserve/backing attestation (auditor and frequency), redemption enforceability, custody, scale and track record.
- CEX listings - the score reflects the exchange as custodian: proof-of-reserves, regulation, hack history.
- A tokenized stock held at a CEX takes the weaker of the issuer vs the exchange - you are exposed to both.
Holder rights
The core question MyRWA answers: what do you actually own? Every listing carries a "Holder gets" badge; hover it for the exact legal meaning. Filled badges are real claims (ownership); outlined ones are price exposure only.
Per-listing types
- Equity - a direct legal claim on the underlying share (or a token redeemable for it).
- Title - redeemable title to the physical commodity in custody, not just its price.
- Debt note - a debt note tracking the price; the issuer owes the value, you have no claim on the share.
- Synthetic - derivative/perp price exposure only, no claim on any underlying asset.
Trade: swaps, mint walkthroughs & referrals
Every listing has a Trade button. A middle-click or open-in-new-tab always lands directly on the exact pair or mint page for that venue - never a generic home page. A normal click opens the right tool for the venue type:
- Solana DEX listings - an embedded Jupiter swap right in the pop-up: connect a Solana wallet and buy the token without leaving MyRWA. The widget is Jupiter's own (Solana's official aggregator), loaded from Jupiter itself.
- EVM DEX listings (Ethereum, Base, Arbitrum, BNB, Polygon) - a native CoW Swap form: you sign a gasless, MEV-protected order in your own wallet and a solver settles it on-chain. Works with any injected wallet (MetaMask, Rabby, Phantom, ...) plus WalletConnect. Tokenized stocks trade only during market hours - off-hours the form says so and shows the session clock instead of failing quotes. Paying with the chain's native coin routes through CoW's EthFlow contract. If CoW has no route for a token, the pop-up gives a working route instead - the measured pool page, or a router (Matcha, Jupiter) that can quote the token.
- Robinhood Chain listings - the same native form, routed through the LI.FI aggregator (CoW has no deployment there): one on-chain transaction against the Uniswap/Rialto pools, paying in USDG, WETH or native ETH. Robinhood Stock Tokens are debt securities of Robinhood Assets (Jersey) tracking the stock, they trade 24/7 - the banner explains that off-hours prices can drift from the last close. The direct link on the row deep-links the Uniswap app with the token pre-filled.
- Honest ≈$ marks - for stocks, ETFs and indices the widget's ≈$ lines under "pay" and "receive" are priced from the live market price of the underlying share, not from the pool's last trade (thin-pool marks lag and mislead both ways); a small note in the form states the reference price. Commodity wrappers (gram- or ounce-denominated) fall back to the live pool price. If the quote gives you over ~3% less value than you pay, an explicit warning appears before you can sign.
- Live depth check - when the widget opens on a pool the $2k-$25k test size can out-size (about 3× its LP), MyRWA quietly test-quotes it and reports the answer in the pop-up: a green line means a maker/RFQ source is filling beyond pool depth right now at a price near the live market; an amber line means the quote is missing or far off the live price at the moment, so keep orders small. Deep pools that swallow the whole test size skip the line - it would prove nothing there. On Solana the check reads Jupiter's router directly (an RFQ maker vs an AMM route).
- Thin pools - for pools under $100k LP a blocking warning covers the swap; you must explicitly accept the risk before the widget unlocks (keyboard focus is held on the warning too). Exception: ◆RFQ listings never get the blocker - an RFQ market maker fills beyond pool depth at a flat spread, so the pop-up explains that instead of warning.
- Issuer mint/redeem listings - a KYC-first walkthrough: the pop-up states that the issuer verifies identity before minting and links the exact pages in order - 1 - Pass KYC, 2 - Mint / redeem. When mint and redeem live on different pages (Matrixdock, VNX) all steps are laid out in a small table. Links are the retail routes only; issuers with no retail mint carry a note instead (Backed - professional/KYB only; Paxos - retail onboarding closed; Tether Gold - $200k minimum) pointing you at the exchange/DEX rows of the same asset.
- CEX and perp venues - if MyRWA has a referral for the venue, the click first offers "Sign up on <venue>" vs "Go to the pair"; with no referral it goes straight to the pair.
- xStocks tokens (Backed) additionally offer the xStocks points program link - register, hold the token, earn campaign points.
Registering or swapping through MyRWA supports this free service (referral codes, and a small fee built into the embedded swap widgets); going straight to the pair costs you nothing. Referrals and fees never change the data, the ranking or the trust scores.
Data, sources & methodology
What "Data snapshot" means
The footer shows a Data snapshot date:
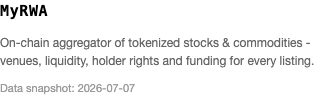
It is the date the whole dataset was last rebuilt from source. On each run the pipeline re-pulls every issuer registry and venue API and reassembles the catalog from scratch: the asset list, every listing, liquidity (LP / 24h volume / OI), the baseline funding rates, the trust scores, and the RFQ signals. In plain terms - the static data is current as of this date.
The live parts sit on top and refresh on their own, roughly every minute (edge-cached): the underlying prices, the on-chain pool prices, the perp marks and Hyperliquid funding. The snapshot date marks the base rebuild of everything else.
Sources
- Underlying prices - Yahoo Finance, with live FX conversion for foreign shares.
- On-chain token prices - DexScreener (deepest pool), with a GeckoTerminal fallback for chains it does not index.
- LP depth - GeckoTerminal, summed across all pools per token.
- CEX / perp funding, volume, OI and marks - each exchange's public API; live perp marks via a once-a-minute snapshot of the major venues (best-effort by region).
- RFQ fill (LP-RFQ) - detected by quoting each on-chain wrapper through an RFQ aggregator and recording where a market maker fills at a fixed spread; refreshed on a weekly cycle.
- Live service health - see the status page for per-source freshness.
- Referral disclosure - some Trade buttons are referral links. They never change the data, ranking or scores.
- Not investment advice. Everything is aggregated from public on-chain and exchange data and provided "as is", without warranty. Data may be delayed or incomplete. Always verify the contract address before trading.